

What product data enrichment actually means
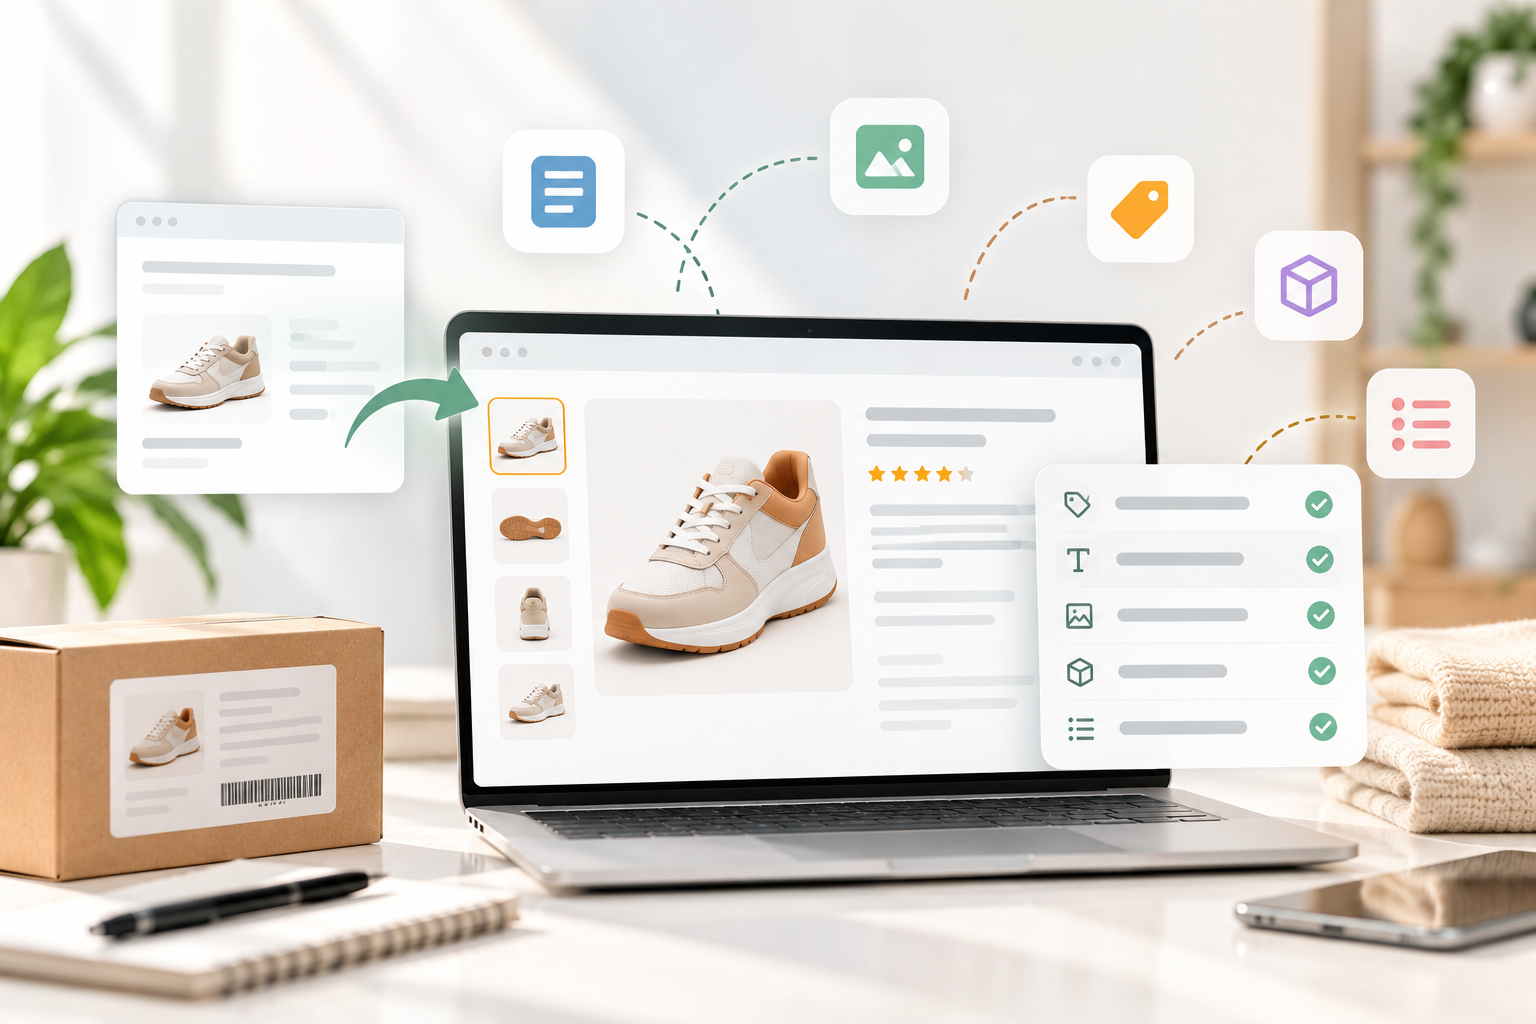
It is not the same as writing longer descriptions. A 400-word description with no structured size, material or compatibility fields is still thin product data. Machines need fields they can filter and compare, not just prose.
Why thin product data caps revenue
Thin records hurt revenue through three separate mechanisms. Each one is easy to miss on its own.
Retrieval fails.
A shopper searches for “waterproof hiking boots, wide fit.” If “wide” lives only in a description and “waterproof” is not a field, the search engine has little to match. Industry research has long shown that many ecommerce search problems are data and interface problems rather than algorithm problems (Baymard Institute).
Filters lie.
A filter for “waterproof” returns only the products where someone remembered to tick the box. As a result, shoppers who filter see a smaller catalog than you actually stock.
Recommendations go generic.
Similarity needs something to compare. When records are sparse, recommendation engines fall back on popularity. Consequently, every shopper sees the same bestsellers.
All three cost revenue. None of them show up as an error.
The forecast: product data becomes the moat
Here is the shift we expect over the next three years.
Search and recommendation technology is commoditizing. Hybrid retrieval, embeddings and reranking are becoming standard. Meanwhile, AI assistants increasingly compare products using structured fields.
So the technology gap between retailers is narrowing. The product data gap is not. Two stores running similar engines will see very different results, and the difference will be catalog quality. In short, enriched product data is becoming the advantage competitors cannot buy off the shelf.
That is also why we see it as the first step in any future of ecommerce plan.
AI Search Grader by bCloud AI
Grade your ecommerce search in 10 quick questions
31% of ecommerce searches return zero results — and most shoppers who hit a dead end leave for a competitor. How does your store's search stack up?
Answer 10 short questions and get your AI search score, plus a personalized report to fix the gaps. Free, takes about 2 minutes.
No signup needed to take the quiz.
Understanding intent…
Scoring your answers across relevance, AI, experience, and insights.
Your AI search score is ready
Tell us where to send your personalized report. You'll see your score and recommendations right away.
Your score by pillar
Personalized recommendations
Fix the gaps in weeks, not quarters
bCloud AI replaces keyword-only search with hybrid AI retrieval — sub-200ms responses, 99.99% uptime, and conversion lifts of up to 40% across 50+ implementations.
What enrichment looks like on a single record
An example makes this concrete. Here is a typical thin record for a pair of boots, before and after enrichment.
Nothing about the boot changed. However, it can now match “wide waterproof hiking boots,” appear in the right filters, and be compared by an assistant. That is the whole case for enrichment in one table.
8 product data enrichment fixes, in priority order
The order matters. Earlier fixes make later ones easier and more measurable.
1. Normalize the attributes you already have
Start with what exists. “Navy,” “navy blue” and “NVY” are one color. “12 in,” “12 inch” and “1 ft” are one length. Normalizing values makes filters accurate overnight, with no new data at all.
2. Fill the comparison fields first
Next, fill the fields a shopper or assistant would use to compare. Size, material, weight, compatibility, warranty and return terms usually top the list. Prioritize by category revenue, not by catalog order.
3. Rescue specs trapped in PDFs and images
Many catalogs hide their best product data in spec sheets, manuals and images. Extract it into fields. Until you do, search, filters and assistants cannot see it.
4. Map your customers’ vocabulary
Your search log shows the words shoppers actually use. “Couch” versus “sofa.” A trade name versus a generic one. Add those terms as synonyms or attributes. This single fix often recovers a surprising share of failed searches. See search returned no results.
5. Add relationships between products
Compatibility, accessories, replacements and bundles are product data too. They power cross-sell and protect basket size. Our guide on average order value shows why this matters for revenue.
6. Add standard identifiers
GTINs, manufacturer part numbers and brand fields help machines match your product to the same item elsewhere. That matters for marketplaces, comparison engines and AI assistants alike. For B2B catalogs, part numbers are often the primary search path. See B2B SKU search.
7. Keep price and stock fresh
Stale product data is worse than missing data. Recommending an out-of-stock item costs trust. Therefore, connect inventory and pricing to the index in near real time. See real-time indexing.
8. Make page, feed and schema agree
Finally, check consistency. The price on the page, in the product feed and in structured data should match. Google’s own Product structured data documentation is the reference for what to mark up. Our product schema markup guide covers implementation.
Where AI helps with product data, and where it does not
AI is now genuinely useful for enrichment. It can extract attributes from descriptions, classify products, suggest synonyms and draft missing fields at scale.
However, it can also invent plausible but wrong values. A model may guess a material or a dimension with total confidence. For that reason, treat AI-generated product data as a draft. Validate high-impact fields, such as compatibility, safety and size, before they go live.
A practical rule: let AI propose, let rules validate, and let a human approve anything a customer could be harmed or misled by. bCloud’s data enrichment and data transformation capabilities are built around that review loop.
How to measure the payoff
Enrichment earns a budget when it shows up in numbers. Track these monthly, before and after each fix.
Then run one change at a time against a control where possible. Otherwise, seasonality will take the credit. Ecommerce search analytics covers the reporting setup.
Product data for B2B and marketplaces
Two catalog types feel the pain of thin product data more than most.
B2B distributors.
Buyers search by part number, specification and compatibility. Often, they do not know the official product name at all. Without complete technical fields, they cannot self-serve, so they call. That moves revenue to a slower and costlier channel. Our guides on AI search for B2B ecommerce and manufacturer site search cover the retrieval side.
Marketplaces.
Here, product data arrives from hundreds of sellers in hundreds of formats. As a result, the same attribute may appear under five different names. Normalization is therefore the first and biggest win. See semantic search for marketplaces.
In both cases, the principle is the same. Enrich the fields buyers compare on, then measure the change in search behavior.
Product data and AI visibility
There is a second payoff most teams miss. The same enriched product data that powers your on-site search also helps external assistants understand your products.
When an assistant compares options, it reads structured attributes. If your warranty, size and compatibility are fields, you can be compared. If they are not, you are often skipped. Our guides on how LLMs find products and AI visibility for ecommerce explain the connection. We also cover the shopper side in AI shopping decisions.
A 90-day product data plan
Enrichment feels endless, so put a box around it. Here is a realistic first quarter.
Days 1 to 30: measure and normalize.
Pull attribute fill rates by category. Export the search log. Then normalize existing values, such as colors, units and sizes. This alone usually improves filters.
Days 31 to 60: fill and map.
Fill the comparison fields in your top revenue categories. Next, add shopper vocabulary from failed searches as synonyms or attributes.
Days 61 to 90: connect and verify.
Add identifiers and product relationships. Connect price and stock for freshness. Finally, check that page, feed and schema agree, and compare your metrics with day one.
By day 90, you will have a before-and-after story backed by numbers. That story is what funds the next quarter.
Who should own product data
Ownership is where most enrichment efforts quietly stall. Merchandising thinks it belongs to IT. IT thinks it belongs to merchandising.
In practice, the best results come from a named owner in merchandising or ecommerce operations, with engineering support for feeds and pipelines. That person should review the search log monthly and report attribute fill rates alongside revenue. If nobody is accountable for product data quality, it will decay as new products arrive.
Common product data mistakes
Enriching in catalog order.
Start with your highest-revenue categories instead.
Writing longer descriptions instead of adding fields.
Prose helps people. Fields help machines.
Trusting AI-generated values without checks.
Confident and wrong is still wrong.
Treating enrichment as a one-time project.
New products arrive thin. Build enrichment into onboarding.
Ignoring the search log.
It is the cheapest source of missing vocabulary you will ever have.
The bottom line on product data
Better product data does not feel like a growth project. It feels like cleanup.
Yet it is the one investment that improves search, filters, recommendations and AI visibility at the same time. As engines converge, product data quality becomes the difference shoppers can actually feel. Start with the fields that drive comparison, measure every change, and keep the loop running.
Frequently asked questions
What is product data enrichment?
Product data enrichment is the process of making each catalog record complete, accurate and machine-readable by filling missing attributes, standardizing values, adding identifiers, mapping customer vocabulary and keeping price and stock current.
Why does product data matter for ecommerce search?
Search engines can only match what they can read. When attributes such as size, material or compatibility are missing or buried in descriptions, relevant products fail to appear, filters return incomplete results, and recommendations fall back to generic bestsellers.
What product data should I enrich first?
Start with the comparison fields in your highest-revenue categories: size, material, weight, compatibility, warranty and return terms. Normalizing existing values first is usually the fastest win because it fixes filters without new data.
Can AI enrich product data automatically?
AI can extract attributes, classify products and draft missing fields at scale, but it can also produce confident wrong values. Treat AI output as a draft and validate high-impact fields before publishing.
How does product data affect AI visibility?
AI assistants compare products using structured information. Complete, consistent attributes and matching structured data make your products easier to understand, compare and recommend.
How do I measure the ROI of product data enrichment?
Track attribute fill rate, zero-result and zero-click search rates, filter usage, recommendation click-through and search conversion rate before and after each change, ideally with a control group.
Is product data enrichment a one-time project?
No. New products often arrive with thin records, and catalogs drift. Build enrichment into product onboarding and review the search log regularly for new vocabulary gaps.
What are GTINs and why do they matter?
GTINs are standard global product identifiers. They help search engines, marketplaces and assistants recognize that your product is the same item listed elsewhere, which improves matching and comparison.
Does enrichment help B2B catalogs too?
Yes, often more. B2B buyers search by part number, specification and compatibility, so complete technical fields and identifiers directly affect whether buyers can self-serve.
Find out how complete your product data really is.
bCloud AI will profile your catalog, show attribute fill rates by category, and map your failed searches to the missing fields behind them. Bring your product feed.
bcloud.ai